

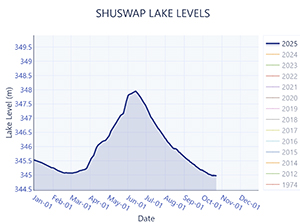
Graph Instuctions
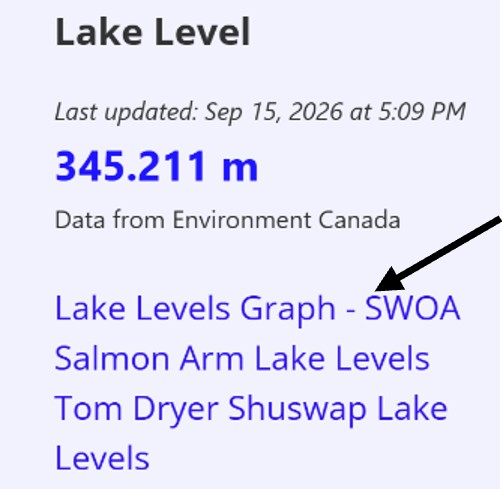
On the SWOA website members must first login to the site to be able to access a lake level graph. This shows the current lake level, in graph form, where one can compare the levels for the past 12 years plus the year 2012, one of the highest lake-level years.
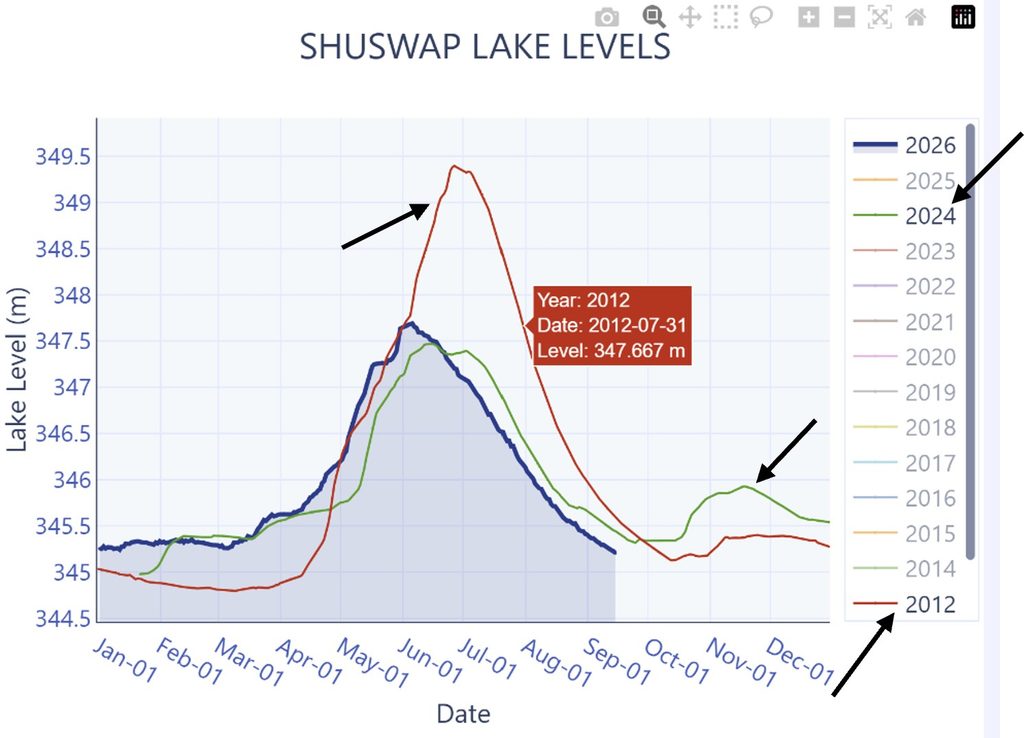
Clicking on the years located on the right side of the graph will toggle the graph for that year.
Placing your cursor on the line will give the lake level and date
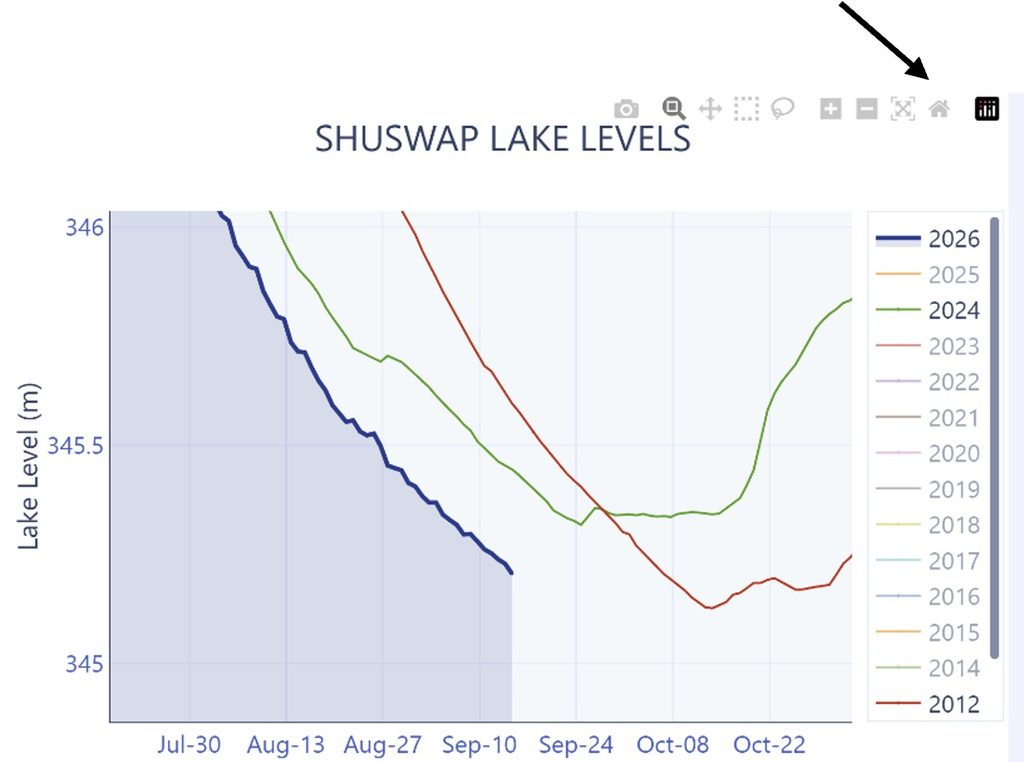
Using your cursor and left mouse button to highlight an area will magnify the area and clicking on a top icon (arrow)will reset the axes.
SWOA hopes you will enjoy the lake level graph.